We entered 2023 talking about GA4 and we’re doing the same thing in 2024. Frequent readers of Search Engine Land – and all SEOs, for that matter – know why: GA4 wasn’t ready for prime time when Google forced us to make the switch, and we’re still working through kinks months later.
Having said that, I have managed to hone in on a few extremely valuable GA4 reports that I’m using to help my clients set their course for organic growth in 2024. Let’s dig into:
- What they are.
- How to set them up.
- What they show you.
- How to use the insights.
Report 1: Landing page performance
This report will look at landing page performance segmented by channel. Pick the most relevant date range you’d like to study – for instance, I usually use this as a monthly or quarterly lookback.
Mechanics
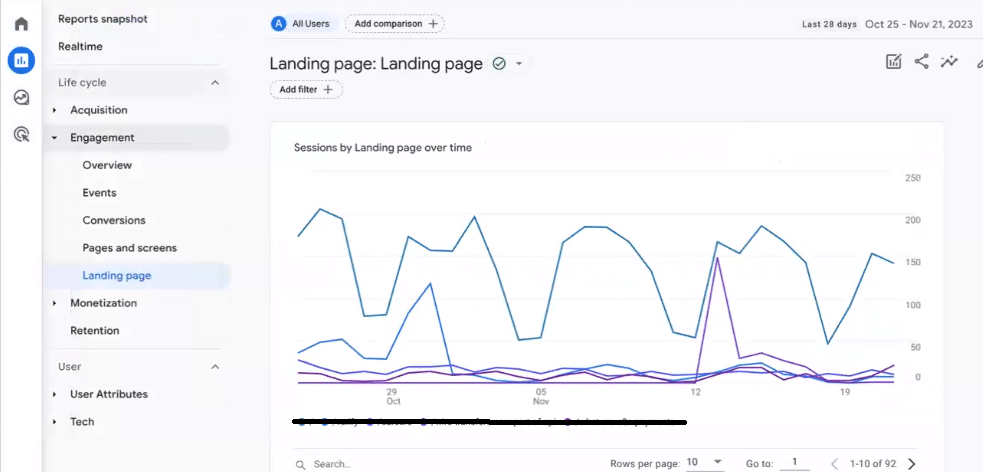
First, go to Engagement > Landing Page:

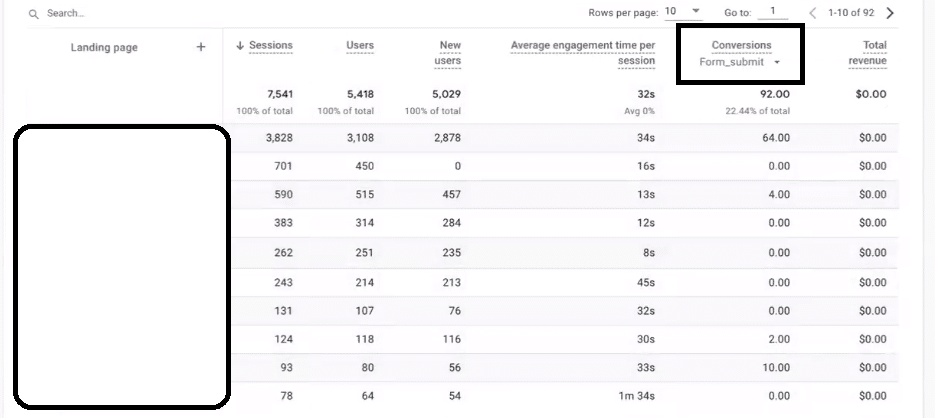
Next, make sure you have a Conversion column added, and specify the primary conversion you’d like to analyze (here, we’re examining form submissions):

For an extra layer of insights, add a Source/Medium dimension to the report:

What does it show you?
This gives marketers a tidy look into a few opportunities.
First, if you sort by descending sessions, you can see top-viewed landing pages and quickly assess which are lagging in conversion rate.
This should prompt an inspection of the page – whether it’s optimized for conversion, no matter the traffic source.
Next, you can sort by lowest sessions and look for pages with little volume with registered conversions. These may be more niche-y, but they can help you identify conversion-friendly properties and/or themes you can double down on with extra ad spend.
Sliced into landing page and channel performance, you’ll also be able to see, among other insights, which channels might badly need ad-to-landing page optimization.
How do you bake the insights into your strategy?
First, high-volume landing pages drawing a lot of ad spend (and/or organic attention) and few conversions should be high on your list of properties to optimize in 2024.
You may also want to run the list by your product team to assess whether there are any market misalignments or competitive disadvantages that the page performance is hinting at.
Second, the lower-volume pages succeeding at converting users should carry some insights on what’s working that you should try to replicate – or amp up with additional resources.
Report 2: Content gap analysis
You don’t need much GA4 manipulation for this one – what you do need is an idea of the segments you’re looking to audit for content.
This could mean stages of the buying journey (top, middle, bottom), primary products/services, or types of audiences/personas.
Mechanics
You can use the landing page report above to determine the list size you’d like to study. Download the top 20, 50, or 100 (for instance) landing pages, and start categorizing each according to your segments in focus.
What does it show you?
When you’re finished, you’ll clearly see which segments need attention in 2024.
One common use case (and outcome) is a content gap analysis by stages of the buying journey, where blogs fill the top of the funnel, resources and About pages fill the middle, and pages like “Get in touch,” pricing, and comparison charts address the bottom of the funnel.
This report lets you track how many of each page type you’re creating and assess the mix of content representing each stage. You might find something like, of the 100 pieces of content on your website, 90 of them are thought leadership blog posts, and 10 of them are Contact and bottom-funnel pages, but the middle of the funnel is under-represented.
I often find that brands have overloaded their content in the middle of the funnel, talking all about themselves and their products. This comes at the expense of top-of-funnel content that builds awareness about the brand and product and brings users into the journey to begin with.
How do you bake the insights into your strategy?
Ensure you align with overall business goals before taking action on your content gap analysis findings. If, for example, your business’s top priority is to build awareness for one particular product, the analysis you just ran showing a lack of content for other products is something to tuck away but not act on.
Ideally, the analysis would show a clear opportunity to contribute to your business’s primary goals. If there’s an audience (let’s say CFOs) in focus where there’s some content but room for more, you can drill down to:
- Examine CFO-specific topics you’ve already covered and look to optimize those pages.
- Build CFO-related content to cover what you haven’t yet touched on.
Report 3: Funnel exploration
This report lets you pick out a top entry page (or several) and analyze how users behave once they get there. One of my favorite use cases is to see how many people are actually converting from blog posts, which I’ll show in the example below.
Mechanics
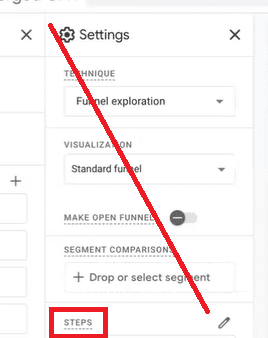
First, go to Explorations > Funnel exploration:

Edit your funnel steps:

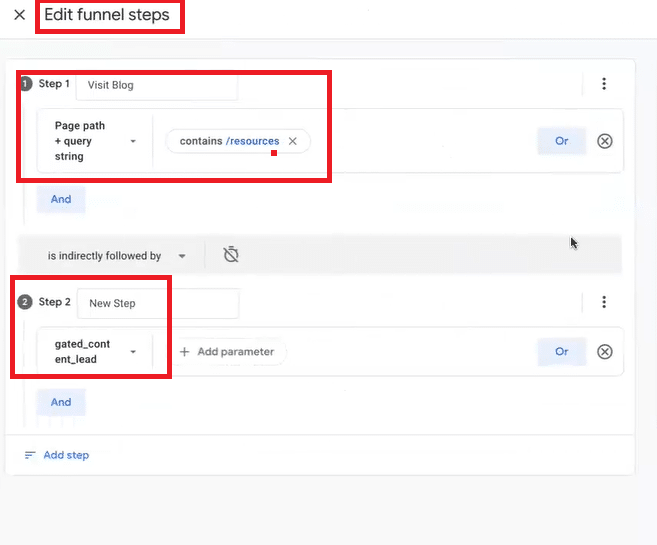
Then, set up your flow. Below, I’ve specified that the first page visited must contain /resources (which is the client’s blog URL), and I’ve added a conversion event (gated lead form) as another step to be completed at some point in the user’s visit:

Add a Dimension or Breakdown of first user medium if you’d like to see the channel that brought the user to your page. In this example, I was able to deliver the client some pretty eye-opening data:

What does it show you?
This example showed that, while the client successfully brought people to their site through blog content (mostly from organic sources), the blog rarely converted.
This is a call to action to change your conversion strategies – examine, for instance, the CTA to see if it aligns with the type of content the user consumes.
How do you bake the insights into your strategy?
The example above shows you how to identify big chunks of your earned properties ripe for conversion optimization, but you can use the funnel exploration report in several ways.
One thing I like to show clients is to start with the homepage, ask them to define the journey they’d like users to take, and run the report to see how many are actually following through.
If the number is lower than expected, sketch out some UX testing to understand why – and strategize how to be more proactive about directing users to go where you want them.
Set your 2024 SEO course with these 3 valuable GA4 reports
Ultimately, I still think GA4 will be a useful platform that will be a necessary touchpoint for marketing teams – particularly if the platform can incorporate insights on SGE as Google expands that footprint.
While we’re all (hopefully) trying to stick to our 2024 resolutions, try rolling up your sleeves and making the most of what GA4 has to offer. If Google meets us halfway and makes the platform more intuitive and consistent, fluency with its levers will end up being worth the time and effort.
https://ift.tt/JXwlM8h
from Search Engine Land https://ift.tt/8COiB6X
via IFTTT


No comments:
Post a Comment
Thanks and response you soon